|
Miltenyi Biotec
anti cd11c magnetic bead isolation Anti Cd11c Magnetic Bead Isolation, supplied by Miltenyi Biotec, used in various techniques. Bioz Stars score: 96/100, based on 1 PubMed citations. ZERO BIAS - scores, article reviews, protocol conditions and more https://www.bioz.com/product/cd11c+magnetic+beads/CD11c+MicroBeads+UltraPure%2C+mouse/pmc11073794-112-4-17 Average 96 stars, based on 1 article reviews
anti cd11c magnetic bead isolation - by Bioz Stars,
2026-09
96/100 stars
|
Buy from Supplier |
|
STEMCELL Technologies Inc
cd11c + magnetic bead sorting  Cd11c + Magnetic Bead Sorting, supplied by STEMCELL Technologies Inc, used in various techniques. Bioz Stars score: 90/100, based on 1 PubMed citations. ZERO BIAS - scores, article reviews, protocol conditions and more https://www.bioz.com/product/cd11c+magnetic+beads/easysep+human+t+cell+isolation+kit/pmc04333072-49-7-24 Average 90 stars, based on 1 article reviews
cd11c + magnetic bead sorting - by Bioz Stars,
2026-09
90/100 stars
|
Buy from Supplier |
|
Miltenyi Biotec
anti mouse cd11c antibody Anti Mouse Cd11c Antibody, supplied by Miltenyi Biotec, used in various techniques. Bioz Stars score: 96/100, based on 1 PubMed citations. ZERO BIAS - scores, article reviews, protocol conditions and more https://www.bioz.com/product/cd11c+magnetic+beads/CD11c+Antibody%2C+anti-mouse/pmc03628333-136-6-13 Average 96 stars, based on 1 article reviews
anti mouse cd11c antibody - by Bioz Stars,
2026-09
96/100 stars
|
Buy from Supplier |
|
Miltenyi Biotec
cd11c magnetic microbeads 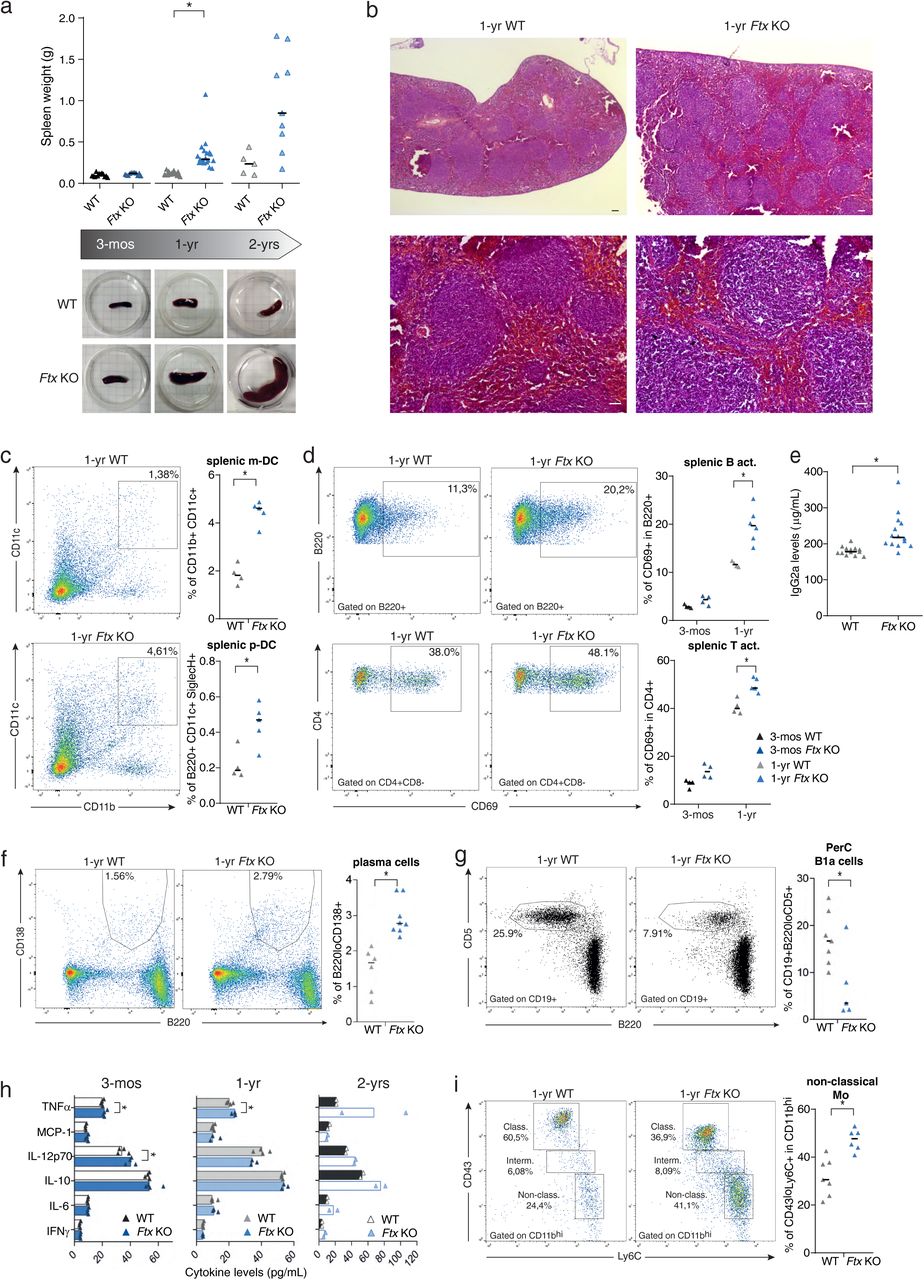 Cd11c Magnetic Microbeads, supplied by Miltenyi Biotec, used in various techniques. Bioz Stars score: 96/100, based on 1 PubMed citations. ZERO BIAS - scores, article reviews, protocol conditions and more https://www.bioz.com/product/cd11c+magnetic+beads/CD90%2E2+MicroBeads%2C+mouse/bio_rxiv__2023__04__20__537662-187-36-40 Average 96 stars, based on 1 article reviews
cd11c magnetic microbeads - by Bioz Stars,
2026-09
96/100 stars
|
Buy from Supplier |
|
Bio X Cell
depletion monoclonal antibody mab cocktail Depletion Monoclonal Antibody Mab Cocktail, supplied by Bio X Cell, used in various techniques. Bioz Stars score: 97/100, based on 1 PubMed citations. ZERO BIAS - scores, article reviews, protocol conditions and more https://www.bioz.com/product/cd11c+magnetic+beads/Anti-CD8+Cd8A+Antibody/10__1097_slash_mib__0000000000000059-38-10-28 Average 97 stars, based on 1 article reviews
depletion monoclonal antibody mab cocktail - by Bioz Stars,
2026-09
97/100 stars
|
Buy from Supplier |
|
Miltenyi Biotec
cd11c magnetic bead columns  Cd11c Magnetic Bead Columns, supplied by Miltenyi Biotec, used in various techniques. Bioz Stars score: 95/100, based on 1 PubMed citations. ZERO BIAS - scores, article reviews, protocol conditions and more https://www.bioz.com/product/cd11c+magnetic+beads/D+Columns/pmc02602725-208-13-18 Average 95 stars, based on 1 article reviews
cd11c magnetic bead columns - by Bioz Stars,
2026-09
95/100 stars
|
Buy from Supplier |
|
Thermo Fisher
dynabead mouse dc enrichment kit Dynabead Mouse Dc Enrichment Kit, supplied by Thermo Fisher, used in various techniques. Bioz Stars score: 99/100, based on 1 PubMed citations. ZERO BIAS - scores, article reviews, protocol conditions and more https://www.bioz.com/product/cd11c+magnetic+beads/Invitrogen+Dynabeads+Magnetic+Beads/pmc05206495-214-9-14 Average 99 stars, based on 1 article reviews
dynabead mouse dc enrichment kit - by Bioz Stars,
2026-09
99/100 stars
|
Buy from Supplier |
|
Bio-Rad
mouse anti rat cd11c alexa fluor 647 antibody  Mouse Anti Rat Cd11c Alexa Fluor 647 Antibody, supplied by Bio-Rad, used in various techniques. Bioz Stars score: 93/100, based on 1 PubMed citations. ZERO BIAS - scores, article reviews, protocol conditions and more https://www.bioz.com/product/cd11c+magnetic+beads/Mouse+anti+Rat+CD63%3AAlexa+Fluor+647/pm20584093-77-9-14 Average 93 stars, based on 1 article reviews
mouse anti rat cd11c alexa fluor 647 antibody - by Bioz Stars,
2026-09
93/100 stars
|
Buy from Supplier |
|
Miltenyi Biotec
anti cd11c coated magnetic microbeads Anti Cd11c Coated Magnetic Microbeads, supplied by Miltenyi Biotec, used in various techniques. Bioz Stars score: 97/100, based on 1 PubMed citations. ZERO BIAS - scores, article reviews, protocol conditions and more https://www.bioz.com/product/cd11c+magnetic+beads/MS+Columns/pm15470023-56-15-18 Average 97 stars, based on 1 article reviews
anti cd11c coated magnetic microbeads - by Bioz Stars,
2026-09
97/100 stars
|
Buy from Supplier |
|
Cell Signaling Technology Inc
rabbit mab against human cd11c  Figure S3 . " width="250" height="auto" /> Figure S3 . " width="250" height="auto" />Rabbit Mab Against Human Cd11c, supplied by Cell Signaling Technology Inc, used in various techniques. Bioz Stars score: 95/100, based on 1 PubMed citations. ZERO BIAS - scores, article reviews, protocol conditions and more https://www.bioz.com/product/cd11c+magnetic+beads/CD11c+XP+Rabbit+mAb/pmc11293323-8-0-6 Average 95 stars, based on 1 article reviews
rabbit mab against human cd11c - by Bioz Stars,
2026-09
95/100 stars
|
Buy from Supplier |
|
Miltenyi Biotec
cd11c macs beads Figure S3 . " width="250" height="auto" />Cd11c Macs Beads, supplied by Miltenyi Biotec, used in various techniques. Bioz Stars score: 99/100, based on 1 PubMed citations. ZERO BIAS - scores, article reviews, protocol conditions and more https://www.bioz.com/product/cd11c+magnetic+beads/LS+Columns/pmc03577763-63-17-20 Average 99 stars, based on 1 article reviews
cd11c macs beads - by Bioz Stars,
2026-09
99/100 stars
|
Buy from Supplier |
|
Bio-Rad
biotin conjugated hamster anti mouse cd11c ab Figure S3 . " width="250" height="auto" />Biotin Conjugated Hamster Anti Mouse Cd11c Ab, supplied by Bio-Rad, used in various techniques. Bioz Stars score: 93/100, based on 1 PubMed citations. ZERO BIAS - scores, article reviews, protocol conditions and more https://www.bioz.com/product/cd11c+magnetic+beads/Hamster+anti+Mouse+CD11c/pmc03910256-309-20-35 Average 93 stars, based on 1 article reviews
biotin conjugated hamster anti mouse cd11c ab - by Bioz Stars,
2026-09
93/100 stars
|
Buy from Supplier |
Image Search Results
Journal: Journal of immunology (Baltimore, Md. : 1950)
Article Title: β-Catenin Signaling Drives Differentiation and Proinflammatory Function of IRF8-Dependent Dendritic Cells
doi: 10.4049/jimmunol.1402453
Figure Lengend Snippet: β-catenin stabilization directs splenic DC progenitors towards CD8α+ DC development. (A) Intracellular β-catenin expression in naïve Ex3fl/fl and Ex3DC−/− splenic CD11c+ cells. (B) Intracellular β-catenin levels in splenic CD4+ T cells isolated from Ex3fl/fl and Ex3DC−/− mice. The data show results from an individual mouse that is representative of of at least 3 experiments with 3–5 mice per group. (C) Western blot analysis of β-catenin in bone marrow-derived DC from Ex3fl/fl and Ex3DC−/− mice following cytoplasmic (C) and nuclear (N) fractionation. Antibodies against PARP and Rab5 were used for nuclear and cytoplasmic loading controls, respectively. The data are from 1 independent trial. (D and E) Comparison pre-cDC populations from the (D) bone marrow and (E) spleen of Ex3fl/fl and Ex3DC−/− mice by flow cytometry. Numbers in representative plots represent percentages of relevant populations within the indicated gate. Bar graphs show mean percentages plus standard error (S.E.) of relevant populations. The data represent the combination of 2 independent experiments (n=10 mice per group). (F) Levels of splenic pre-CD8α+ DC, defined as CD11c+CD8α−B220−CD24+, in Ex3fl/fl and Ex3DC−/− mice by flow cytometry. The data are representative of 3 independent experiments, each involving 4–5 mice per group. **, p<0.01; ***, p<0.001.
Article Snippet: A single round of positive selection using
Techniques: Expressing, Isolation, Western Blot, Derivative Assay, Fractionation, Comparison, Flow Cytometry

Journal: Journal of immunology (Baltimore, Md. : 1950)
Article Title: β-Catenin Signaling Drives Differentiation and Proinflammatory Function of IRF8-Dependent Dendritic Cells
doi: 10.4049/jimmunol.1402453
Figure Lengend Snippet: β-catenin stabilization expands splenic CD8α+ and plasmacytoid DC populations. (A–G) Mature DC subset analysis of naïve Ex3fl/fl and Ex3DC−/− splenocytes by flow cytometry. (A and B) Percentage and total number of CD11c+ cells in Ex3fl/fl and Ex3DC−/− spleens. (C–E) Percentage and total number of (C and D) CD8α+ DC and (C and E) CD11b+ DC in naïve Ex3fl/fl and Ex3DC−/− spleens. The data are representative of at least 3 independent experiments (n=3–5 mice per group). (F and G) Percentage and total number of B220+PDCA-1+ plasmacytoid DC in naïve Ex3fl/fl and Ex3DC−/− spleens. (H and I) Mature DC subset analysis of naïve Ex3fl/fl and Ex3DC−/− lung tissue by flow cytometry. (H) Plots from representative mice and (I) percentage of CD103+CD11b− lung DC for multiple mice are shown. (J–L) Mature DC subset analysis of naïve Ex3fl/fl and Ex3DC−/− intestinal lamina propria by flow cytometry. (J) Plots from representative mice and percentages of (K) CD103+CD11b− and (L) CD103+CD11b+ intestinal DC for multiple mice are shown. Dots in relevant graphs represent results from individual mice. Bar graphs display means and standard errors of individual mice. The data are representative of at least 2 independent experiments (n=3–5 mice per group). *, p<0.05; **, p<0.01; ***, p<0.001.
Article Snippet: A single round of positive selection using
Techniques: Flow Cytometry

Journal: Journal of immunology (Baltimore, Md. : 1950)
Article Title: β-Catenin Signaling Drives Differentiation and Proinflammatory Function of IRF8-Dependent Dendritic Cells
doi: 10.4049/jimmunol.1402453
Figure Lengend Snippet: β-catenin signaling controls Irf8 expression. (A) Semi-quantitative PCR analysis of Nfil3, Batf3, Id2, and Irf8 mRNA in CD11c+ splenocytes magnetically purified from naïve Ex3fl/fl and Ex3DC−/− mice. mRNA levels were normalized to GAPDH. The data are representative of 2 independent experiments (n=2–3 mice per group) (B) Representative flow cytometric plots of IRF8 expression by Ex3fl/fl and Ex3DC−/− CD8α− and CD8α+ splenic DC. (C) MFI of IRF8 within Ex3fl/fl and Ex3DC−/− CD8α− and CD8α+ DC and (D) the percent of CD8α+ DC expressing IRF8 are shown. Dots represent results from individual mice. The data are the combined results of 2 experiments, and the experiment was independently performed at least 3 times (n=4–5 mice per group). (E) Representative FACS plot of IRF4 expression and IRF4 MFI in Ex3fl/fl and Ex3DC−/− CD11c+ splenocytes. The data are representative of 3 independent experiments (n=4 mice per group). (F) Chromatin immunoprecipitation of naïve Ex3DC−/− Flt3L DC cultures with control IgG or β-catenin antibody followed by quantitative PCR to determine Irf8 promoter occupancy. DNA levels were normalized to 1% input chromatin. The data are representative of 2 independent experiments. (G) Quantitative PCR analysis of Axin2 and Irf8 gene expression in BMDC following 5 hr culture with DMSO or ICG-001. Fold change is relative to DMSO control. The data are from one independent trial. (H and I) Intracellular expression of IRF8 and β-catenin following ICG-001 treatment of BMDC (H) or MutuDC1940 cells (I). The data are representative of 2 (MutuDC1940 cells) and 4 (BMDC) independent experiments with 3 replicates per treatment per experiment. *, p<0.05; **, p<0.01; ***, p<0.001.
Article Snippet: A single round of positive selection using
Techniques: Expressing, Real-time Polymerase Chain Reaction, Purification, Chromatin Immunoprecipitation, Control, Gene Expression

Journal: Journal of immunology (Baltimore, Md. : 1950)
Article Title: β-Catenin Signaling Drives Differentiation and Proinflammatory Function of IRF8-Dependent Dendritic Cells
doi: 10.4049/jimmunol.1402453
Figure Lengend Snippet: β-catenin stabilization enhances IL-12 production by CD8α+ DC. (A) IL-12p40 production by naïve Ex3fl/fl and Ex3DC−/− splenocytes stimulated in vitro with LPS, STAg, or media control measured by ELISA. (B) IL-12p40 production by splenic CD11c+ DC magnetically purified from Ex3fl/fl and Ex3DC−/− mice stimulated in vitro with LPS, STAg, or media control measured by ELISA. (C) IL-12p40 production by CD8α+ and CD8α− DC DC purified from naïve Ex3fl/fl and Ex3DC−/− splenocytes following in vitro stimulation with media or STAg for 48 hr measured by ELISA. (D) IL-12p40 secretion by Ex3fl/fl splenocytes pre-treated with ICG-001 for 5 hr and then stimulated overnight with LPS or STAg measured by ELISA. (E) IL-12p40 production by splenocytes (106) from Ex3DC−/− mice cultured for 5 hr with 5 μM ICG-001 or DMSO and then stimulated with media, LPS (100 ng/ml), or STAg (25 μg/ml) overnight. (F) IL-12p40 production by MutuDC1940 cells (105) pre-treated with 20 μM ICG-001 or DMSO for 2 hr and then stimulated with media or STAg (25 μg/ml) overnight. The data are representative of at least 3 (A, F) and 2 (B–E) independent experiments, each involving 3–5 mice per group, except (C), which used pooled samples from 3 mice per experiment. *, p<0.05; **, p<0.01; ***, p<0.001.
Article Snippet: A single round of positive selection using
Techniques: In Vitro, Control, Enzyme-linked Immunosorbent Assay, Purification, Cell Culture

Journal: Journal of immunology (Baltimore, Md. : 1950)
Article Title: β-Catenin Signaling Drives Differentiation and Proinflammatory Function of IRF8-Dependent Dendritic Cells
doi: 10.4049/jimmunol.1402453
Figure Lengend Snippet: Constitutive DC β-catenin signaling increases the proinflammatory cytokine response to Toxoplasma. (A) Survival of Ex3fl/fl and Ex3DC−/− mice following i.p. infection with Toxoplasma Type II strain ME49 (25 cysts) (n=4–6 mice per group). The data are representative of at least 3 experiments. (B) Quantitative PCR amplification of parasite (B1 gene) and host DNA (ASL gene) isolated from Ex3fl/fl and Ex3DC−/− spleens 9 days post-infection. Parasite load is displayed as a ratio of parasite genomes to host genomes (n=3–4 mice per group). (C) IL-12p40 production by CD11c+ DC magnetically separated from Day-6 post-infection Ex3fl/fl and Ex3DC−/− splenocytes and cultured overnight without additional stimulation (n=3 mice per group). (D) IL-12p70 production by bulk splenocytes from Day-6 post-infection Ex3fl/fl and Ex3DC−/− mice (n=3 mice per group). The data are representative of 2 independent experiments. (E) IL-12p40 and IFN-γ production by splenocytes from Day-10 post-infection Ex3fl/fl and Ex3DC−/− mice cultured for 72 hr without additional stimulation (n=3–5 mice per group). The data are representative of 3 independent experiments. (F) IL-12p40, IFN-γ, and TNF-α levels in serum collected from Day-9 post-infection Ex3fl/fl and Ex3DC−/− mice (n=3–5 mice per group). The data are representative of 2 independent experiments. The means and S.E. of individual mice are shown. *, p<0.05; **, p<0.01.
Article Snippet: A single round of positive selection using
Techniques: Infection, Real-time Polymerase Chain Reaction, Amplification, Isolation, Cell Culture
Journal: bioRxiv
Article Title: Altered X-chromosome inactivation predisposes to autoimmune manifestations in mice
doi: 10.1101/2023.04.20.537662
Figure Lengend Snippet: a. Spleen weight of wild-type (WT) and Ftx KO females at 3-months, 1-year and 2-years of age. Median values are shown. ( t-test , * p -values < 0.05). Underneath, representative images of WT and Ftx KO spleens from 3-month, 1-year and 2-year-old females. b. Representative images of hematoxylin-eosin staining on sections of spleens from 1-year-old WT and Ftx KO females. Scale bar; 100 μm. c. Representative flow cytometry analysis of splenic myeloid dendritic cells (m-DC) in WT and Ftx KO 1-year-old females. On the right, percentages of splenic m-DC (CD11b + CD11c + ) and splenic plasmacytoid dendritic cells (p-DC) (CD11c + B220 + SiglecH + ) in leucocytes. Each triangle represents a mouse. Median values are shown. ( t-test , * p -values < 0.05). d. Representative flow cytometry analysis of spontaneously activated B cells (B220 + CD69 + ) (upper panels) or of spontaneously activated T cells (CD4 + CD69 + ) (lower panels) in spleen from 1-year-old WT and Ftx KO females. Percentages in leucocytes are shown on the graphs beneath. Each triangle represents a mouse. Median values are shown. ( t-test , * p -values < 0.05). e. IgG2a natural antibody levels in sera of 1-year- and 2-year-old WT or Ftx KO females measured by ELISA. Each triangle represents a mouse. Median values are shown. ( t-test , * p -values < 0.05). f. Representative flow cytometry analysis of (B220 + CD138 + ) plasma cells in the spleen of 1-year-old WT and Ftx KO females. Percentages in leucocytes are shown on the graphs beneath. Each triangle represents a mouse. Median values are shown. ( t-test , * p -values < 0.05). g. Representative flow cytometry analysis of (CD19 + B220 lo CD5 + ) natural antibody producing B1a in the peritoneal cavity (PerC) of 1-year-old WT and Ftx KO females. Percentages in leucocytes are shown on the graphs beneath. Each triangle represents a mouse. Median values are shown. ( t-test , * p -values < 0.05). h. Cytokines levels in the blood analysed with CBA assays on sera from 3-month-, 1-year-, or 2-year-old WT and Ftx KO females. Each triangle represents a mouse. Median values are shown. ( t-test , * p -values < 0.05). i. Representative flow cytometry analysis of monocyte populations including non-classical (CD11b hi CD43 lo Ly6C + ) scavenger monocytes in the spleen of 1-year-old WT and Ftx KO females. Percentages in leucocytes are shown on the graphs beneath. Each triangle represents a mouse. Median values are shown. ( t-test , * p -values < 0.05).
Article Snippet: After isolation, spleen or bone marrow cells were stained for 30 min on ice with Anti-CD23 Magnetic Microbeads (130-098-784, Miltenyi Biotec) or Anti-F4/80 Magnetic Microbeads (130-110-443, Miltenyi Biotec) or Anti-CD11b Magnetic Microbeads (130-126-725, Miltenyi Biotec) or
Techniques: Staining, Flow Cytometry, Enzyme-linked Immunosorbent Assay, Clinical Proteomics
Journal: PLoS Biology
Article Title: Twist-2 Controls Myeloid Lineage Development and Function
doi: 10.1371/journal.pbio.0060316
Figure Lengend Snippet: (A and B) Semiquantitative (A) and quantitative (B) RT-PCR of sorted hematopoietic progenitor populations showing constitutive expression of Twist-2 in GMP and CMP populations. Data are normalized to 18s rRNA internal controls and representative of two independent experiments. Error bars indicate the standard deviation (SD). (C) Splenocytes of Twist-2 KO and WT littermates were analyzed by flow cytometry. Results are representative of eight independent pairs of mice analyzed. Splenic CD4 + and CD8 + T cells (upper panel), IgM + and IgD + B cells (middle panel), and CD11b + and Gr-1 + granulocytes and macrophages (lower panel) are shown. (D) Flow cytometry showing expansion of CD11b + Gr-1 + myeloid cells in peripheral blood (upper panel), liver (middle panel), and BM (lower panel) of Twist-2 KO mice representative of six independent experiments. (E) Flow cytometric analysis of splenocytes showing the expansion of Gr-1 low CD11b + F4/80 high macrophages (upper panel) and F4/80 low CD11b + Gr-1 high neutrophils (lower panel) in Twist-2 KO mice representative of three independent experiments. (F) Absolute cell counts of CD11c + cells and two major DC subtypes, CD11c + CD11b + CD4 + and CD11c + CD11b − CD8 + cells, are both increased in Twist-2 KO spleen. Error bars indicate SD. (G) Images of whole bone mounts stained with H&E (left panels). BM touch preps stained with Wright-Giemsa (right panels) show higher numbers of mature myeloid cells in the Twist-2 KO BM. (H) Images of peripheral blood smears with Wright-Giemsa stain showing hypersegmented neutrophils and enlarged monocytoid cells in Twist-2 KO mice. Images are representative of four independent sets of peripheral blood smears. The arrow indicates the hypersegmented nuclei of the neutrophils.
Article Snippet: Primary CD11c + splenic DCs were purified from single-cell suspensions of splenocytes using
Techniques: Reverse Transcription Polymerase Chain Reaction, Expressing, Standard Deviation, Flow Cytometry, Staining, Giemsa Stain
![(A) Flow cytometry of splenocytes cultured in complete medium and stimulated with TNFα (5 μg/ml) for 24 h. Cells were stained with CD11b, Gr-1, and Annexin-V antibodies and PI to determine relative apoptotic and necrotic populations from one of the representative repeated experiments. (B) Flow cytometry of BMDC derived from Twist-2 KO mice or WT littermates at day 10 of culture from one of the representative repeated experiments. Cells were stained with CD11c and Annexin-V antibodies and PI. (C) Flow cytometric analysis showing a subtle decrease in Lin − c-Kit + Sca1 + HSC compartment in Twist-2 KO mice. Results are representative of four independent experiments. (D) Flow cytometric analysis showing a significant increase in Lin − IL7R − Sca1 − c-Kit + CD34 + FcγR + GMP population in BM of Twist-2 KO mice representative of six independent experiments. (E) Flow cytometric analysis showing a significant increase in Lin − c-Kit int Flt3 + M-CSFR + DC precursors in the BM of Twist-2 KO mice. Representative of two independent experiments. Error bars indicate SD. (F and G) Twist-2 KO mice have increased IA/IE − CD11c + DC precursors ([F]) in the peripheral blood and increased Lin − IL7R − c-Kit + FcγR + Beta7 high BMCP as well as Lin − IL7R − c-Kit + FcγR + Beta7 −/lo GMP in Twist-2 KO spleen (G). Results are representative of three independent experiments.](https://pub-med-central-images-cdn.bioz.com/pub_med_central_ids_ending_with_2725/pmc02602725/pmc02602725__pbio.0060316.g002.jpg)
Journal: PLoS Biology
Article Title: Twist-2 Controls Myeloid Lineage Development and Function
doi: 10.1371/journal.pbio.0060316
Figure Lengend Snippet: (A) Flow cytometry of splenocytes cultured in complete medium and stimulated with TNFα (5 μg/ml) for 24 h. Cells were stained with CD11b, Gr-1, and Annexin-V antibodies and PI to determine relative apoptotic and necrotic populations from one of the representative repeated experiments. (B) Flow cytometry of BMDC derived from Twist-2 KO mice or WT littermates at day 10 of culture from one of the representative repeated experiments. Cells were stained with CD11c and Annexin-V antibodies and PI. (C) Flow cytometric analysis showing a subtle decrease in Lin − c-Kit + Sca1 + HSC compartment in Twist-2 KO mice. Results are representative of four independent experiments. (D) Flow cytometric analysis showing a significant increase in Lin − IL7R − Sca1 − c-Kit + CD34 + FcγR + GMP population in BM of Twist-2 KO mice representative of six independent experiments. (E) Flow cytometric analysis showing a significant increase in Lin − c-Kit int Flt3 + M-CSFR + DC precursors in the BM of Twist-2 KO mice. Representative of two independent experiments. Error bars indicate SD. (F and G) Twist-2 KO mice have increased IA/IE − CD11c + DC precursors ([F]) in the peripheral blood and increased Lin − IL7R − c-Kit + FcγR + Beta7 high BMCP as well as Lin − IL7R − c-Kit + FcγR + Beta7 −/lo GMP in Twist-2 KO spleen (G). Results are representative of three independent experiments.
Article Snippet: Primary CD11c + splenic DCs were purified from single-cell suspensions of splenocytes using
Techniques: Flow Cytometry, Cell Culture, Staining, Derivative Assay

Journal: PLoS Biology
Article Title: Twist-2 Controls Myeloid Lineage Development and Function
doi: 10.1371/journal.pbio.0060316
Figure Lengend Snippet: (A) Induced expression of Twist-2 mRNA in CD11c + BM DCs after 4 h of stimulation of LPS (100 ng/ml), as demonstrated by quantitative RT-PCR. Data are normalized to 18S rRNA internal controls, with samples loaded in triplicate from repeated experiments. (B) Representative cytokine production by Twist-2 KO and WT DCs after 24 h of stimulation with 100 ng/ml LPS. Data, presented as mean ± SD, are representative of three independent experiments. (C) Endotoxin tolerance assays. DCs were pretreated with 100 ng/ml LPS for 24 h, washed twice in complete medium, and then allowed to rest for 2 h, and then restimulated with 100 ng/ml LPS for an additional 24 h, after which the culture supernatant was collected and assayed. Data are representative of three independent experiments. (D) Representative cytokine production by WT BMDC and Twist-2 KO BMDC transfected with either empty vector control or Twist-2 expression vector. Cells were then stimulated with 100 ng/ml LPS for 24 h. Data presented as mean ± SD are representative of two independent experiments.
Article Snippet: Primary CD11c + splenic DCs were purified from single-cell suspensions of splenocytes using
Techniques: Expressing, Quantitative RT-PCR, Transfection, Plasmid Preparation, Control
Journal: International journal of andrology
Article Title: Characterization of dendritic cells in testicular draining lymph nodes in a rat model of experimental autoimmune orchitis.
doi: 10.1111/j.1365-2605.2010.01082.x
Figure Lengend Snippet: Figure 1 Flow cytometric characterization of the dendritic cell (DC)-enriched population of testicular draining lymph node (LN) cells before (A) and after (B) Ox-62-coupled magnetic beads separation. Filled histograms represent all viable cells in the LN single cell suspension labelled with fluorescent conju- gated antibodies directed against CD11c (DC), major histocompatibility complex II, CD45 RA (B cells) or CD3 (T cells). The thick black lines indicate the respective isotype controls. All data are representative of at least three independent experiments with similar results.
Article Snippet: Subsequently, enriched DC populations were stained with the primary
Techniques: Magnetic Beads, Suspension, Immunopeptidomics
Figure S3 . " width="100%" height="100%">
Journal: Cell Reports Medicine
Article Title: Mitochondrial DNA-boosted dendritic cell-based nanovaccination triggers antitumor immunity in lung and pancreatic cancers
doi: 10.1016/j.xcrm.2024.101648
Figure Lengend Snippet: cNP cancer cell @MV DC treatment triggers DC maturation and CD8 + T and NK cell activation in vitro (A and B) FACS analysis measured CD86 expression in immature human/mouse DCs after treatments. Bar charts display the percentage of CD11c + CD86 + DCs per group ( n = 3 independent experiments). (C and D) FACS analysis examined human/murine CD3 + CD8 + T cell proliferation after treatments ( n = 3 independent experiments). (E–H) FACS analysis assessed human/murine CD3 + CD8 + T cell activation after treatments. Bar charts show the percentage of CD3 + CD8 + CD69 + T cells or CD3 + CD8 + IFN-γ + T cells per group ( n = 3 independent experiments). (I–L) FACS analysis assessed human/murine NK cell activation after treatments. Graphs show the percentage of CD3 − CD56 + CD69 + , CD3 − NK1.1 + CD69 + , CD3 − CD56 + IFN-γ + , or CD3 − NK1.1 + IFN-γ + relative to the total human/murine NK population in each group ( n = 3 independent experiments). (M and N) Schematic diagrams illustrate LDH release assays conducted on PDAC patient-derived tumor organoids (T, target), using varying ratios of CD3 + CD8 + T cells (E, effector) pre-treated with the indicated treatments (M), or co-cultured with hDCs pre-treated with the indicated treatments (N). Bar charts indicate the killing efficiency percentage at each E:T ratio among different groups ( n = 3 independent experiments). (O and P) Cytotoxicity LDH release assays on DT6066 cells were conducted using different ratios of CD3 + CD8 + T cells that had been either pre-treated with the indicated treatments (O) or co-cultured with DCs pre-treated with the indicated treatments (P) ( n = 3 independent experiments). (A–L) One-way ANOVA. (M–P) Two-way ANOVA. See also
Article Snippet:
Techniques: Activation Assay, In Vitro, Expressing, Derivative Assay, Cell Culture
 Figures S5 and . " width="100%" height="100%">
Journal: Cell Reports Medicine
Article Title: Mitochondrial DNA-boosted dendritic cell-based nanovaccination triggers antitumor immunity in lung and pancreatic cancers
doi: 10.1016/j.xcrm.2024.101648
Figure Lengend Snippet: cNP DT6066 @MV DC treatment converts immune-cold pancreatic tumors into hot tumors, reduces hypoxia, and enhances blood vessel function (A) FACS analysis of CD11c + CD86 + DCs in orthotopic DT6066 pancreatic tumors after treatments, with a bar chart showing their percentage relative to total lymphocytes ( n = 3 mice per group). (B) FACS analysis of CD3 + CD4 + CD69 + T cells in orthotopic pancreatic tumors after treatments, with a bar chart showing their percentage relative to total CD3 + CD4 + T cells in each group ( n = 3 mice per group). (C) FACS analysis of CD3 + CD8 + CD69 + T cells in orthotopic pancreatic tumors after treatments, with a bar chart showing their percentage relative to total CD3 + CD8 + T cells in each group ( n = 3 mice per group). (D) Representative images of CD11c and CD86 co-immunostaining in tumor sections from each treatment group. Bar chart shows the quantification of CD11c + CD86 + DC × 10 3 per cm 2 in each group ( n = 3 mice per group). (E and F) Representative images of co-immunostaining for CD3 and CD4 (E) or CD8 (F) in tumor sections from each treatment group ( n = 3 mice per group). (G) FACS analysis of CD3 − NK1.1 + NK cells or CD3 − NK1.1 + CD69 + NK cells in orthotopic pancreatic tumors after treatments. Bar charts show their percentage relative to total CD3 − cells (left) or CD3 − NK1.1 + NK cells (right) in each group ( n = 3 mice per group). (H–J) Cytotoxicity LDH release assays of DT6066 cells after co-culture with various ratios of CD3 + CD8 + T cells isolated from tumors (H), lymph nodes (I), or spleens (J) of orthotopic DT6066 pancreatic tumor-bearing mice after treatments ( n = 3 mice per group). (K) FACS analysis of migratory DCs in orthotopic pancreatic tumors and TDLNs from mice treated as indicated. Bar charts show CD86 + CD103 + DCs as a percentage of CD11c + DCs in each group ( n = 3 mice per group). (L) Representative images of CD11c/CD86/CD103 triple immunostaining on paired tumor and TDLN sections in each group. Bar chart shows the percentage of CD11c + CD86 + CD103 + migratory DC × 10 3 per cm 2 in tumors (left) or TDLNs (right) from each group ( n = 3 mice per group). (M–O) Representative microbubble contrast ultrasound images are shown, and bar charts show quantification across the entire tumors, including tumor cores ( n = 3 mice per group). (P) Representative IHC staining of endomucin in tumor sections from each treatment group. Bar chart shows blood vessel diameter (left) or number of blood vessels (right) per cm 2 in each group ( n = 3 mice per group). (Q) Representative image of GLUT1 and endomucin co-immunostaining in tumor sections from each group. Bar chart shows the relative GLUT1 intensity per group ( n = 3 mice per group). (A–G, K, L, and N–Q) One-way ANOVA. (H–J) Two-way ANOVA. Scale bars in (D), (E), (F), and (L) represent 50 μm. (M) 1 cm. (P and Q) 100 μm. See also
Article Snippet:
Techniques: Immunostaining, Co-Culture Assay, Isolation, Triple Immunostaining, Immunohistochemistry

Journal: Cell Reports Medicine
Article Title: Mitochondrial DNA-boosted dendritic cell-based nanovaccination triggers antitumor immunity in lung and pancreatic cancers
doi: 10.1016/j.xcrm.2024.101648
Figure Lengend Snippet:
Article Snippet:
Techniques: Virus, Recombinant, Negative Staining, Lysis, Control, Phospho-proteomics, Cell Isolation, DNA Purification, DNA Extraction, Bicinchoninic Acid Protein Assay, Protein Purification, Magnetic Beads, Software